Predict Station Demand
Use Workload Modeller to predict where to base available appliances to effectively meet a specific level of demand.
The predicted output is available as an Excel workbook of spreadsheets (one per each type of appliance per weekday) showing how many of each type of available appliance should be disturbed.
Together this provides a resource profile which varies hour-by-hour, weekday-by-weekday and will form the basis for designing a ‘static/permanent’ profile to use in a turn out model.
- The resource set can contain both assigned and unassigned appliances.
- Any appliances NOT assigned to a base will be placed by Predict Demand on an hour-by-hour basis; this is based on which stations have the highest number of appliance requests closest to them.
- The allocation of appliances to stations and the assignment of appliances to callouts is governed by tables in the Cadcorp Workload Modeller Add-in database which can be edited to affect model behaviour.
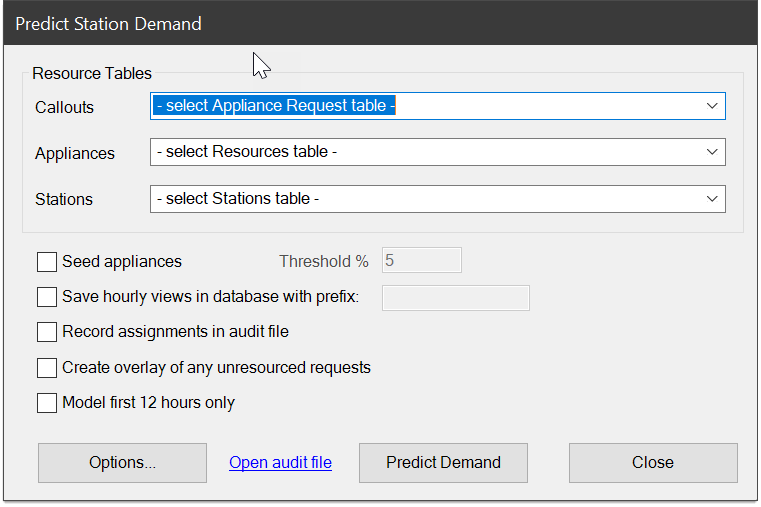
A range of options can be set for Predict Station Demand Model. To do this, select  to open the Predict Station Demand window:
Select the resources from the Callouts, Appliances and Stations drop-down lists.
| Field | Description |
|
Seed appliances - Threshold % |
Performs a rudimentary allocation of unassigned appliances to stations with the vehicle capacity. See below How the model works. |
|
Save hourly views in database with prefix |
Saves copies of these hourly views in the database (as Access queries). This enables each weekday-hour set of appliance-to be displayed as a View Points (Access) or spatial database (SQL Server) overlays in SIS Desktop. There are 168 such views created with names based on the supplied prefix (e.g. Apr06_Sunday00 through to Apr06_Saturday23.) |
|
Record assignments in audit file |
Records assignments in an audit file (this records decisions of unavailability) |
|
Create overlay of any unresourced requests |
Creates an overlay in SIS Desktop |
|
Model first 12 hours only |
Remember to set some options for the model, e.g. the method for allocation appliance requests to stations. |
Click  for more modelling options.
Click  to run the model. You will be prompted for the name of the Excel workbook to be created.
The primary output from Predict Demand is an Excel workbook with weekday worksheets for each vehicle class used showing appliance deployment.
You can also:
- create 168 hour-by-hour views as Access queries in the Cadcorp Workload Modeller database.
- record assignments in the audit file.
- create an overlay in SIS Desktop showing appliance requests which could not be resourced.
- restrict the run to just the first 12 hours (this allows you to quickly see if a model can provide useful results.)
Note: This overlay can be filtered on PredictDay$ and PredictHour& to match time-slots in the Excel Workbook
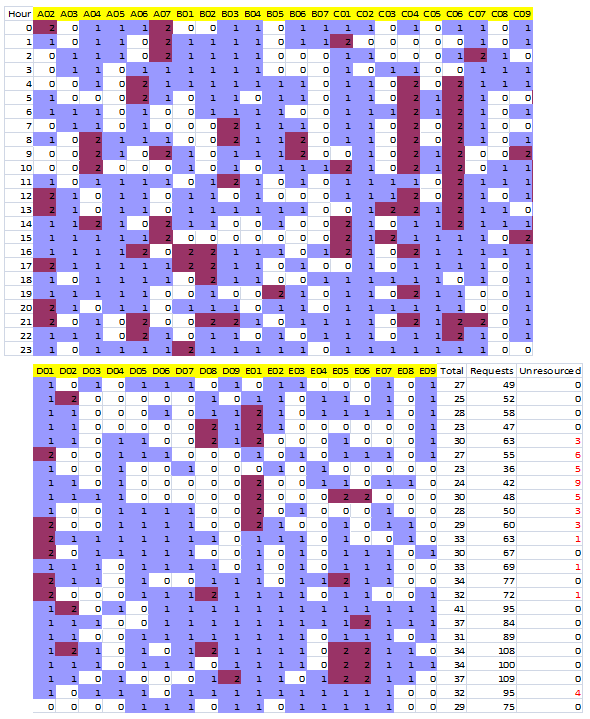
Here is an example of a weekday worksheet (Predict Demand Worksheet Output - split for clarity) from the Predict Demand.
This example is for Appliance Requests attended by PRLs on Saturdays in April 2006.
| Column | Explanation |
| Hour | Hour of the day, e.g. 0= 00:00:00 to 00:59:59 |
| A02 - E09 | One column for each of the stations in the station set. The cells will be colour-coded for the number of appliances deployed at the station in that hour. |
| Total | The total number of appliances of this type used in this hour. |
| Requests | The number of appliance requests for vehicles of this vehicle class’ ‘categorisation’. See How the model works (below). |
| Unresourced | Requests which could not be responded to by vehicles of the class currently being considered. |
| Outside | This column will appear only if the model is run in ‘Station Ground’ mode. This will show how many of the callouts fall outside all station ground areas. |
The model progresses through 168 slices through the data (24x7), i.e. Sunday hour 0 to Saturday hour 23.
For each slice it gets a set of appliance requests overlapping those hours on the basis of assigned and released times.
In turn that hour’s requests are processed for each category of vehicle class that can respond where the categories are:
- Special request, i.e. a request for a special type of vehicle (for instance, only an Aerial can respond to a request for an Aerial appliance)
- Specialised, e.g. some incident types can be responded to by a specialised vehicle (TRV)
- General, i.e. a general purpose vehicle (PRL) should respond.
This categorisation leads to multiple worksheets for each day, e.g. worksheet for aerials (special request), worksheet for TRVs (specialised) and a separate worksheet for the general vehicle.
The model 'seeds' or makes an initial allocation; it then analyses how this allocation meets demand. If available, more appliances are continuously added to the model.
How is the initial allocation (seeding) made?
Seeding is done for each vehicle class for each hour for each weekday.
- If you have more appliances than stations, you could assign an appliance to every station which has respond requests. This results in a very monochrome model because it only takes 1 request for a station to be given an appliance.
- If you have fewer appliances than stations, appliances are assigned to the stations with the most requests.
So the first refinement in the initial allocation is to introduce a threshold, i.e. only allocate an appliance to the station if that station is the ‘nearest’ for a user-specified percentage of the appliance requests.
If a request cannot be responded to by the ‘nearest’ station, other stations are considered in order of proximity.
With no constraint this allows a station further away to be assigned a request if it had a free vehicle.
TIP: A limit can be specified (i.e. consider only the first N of the nearest stations.)
You can also control the selection of nearest neighbour station on the basis of time (based on the target response time for a vehicle type.)
For example, if a PRL has an attendance target of 5 minutes, stations further away than a user-specified factor of 5 minutes will not be used. (In the case of straight line and station ground allocation methods, time to a station is calculated on the basis of average MPH for a vehicle class).
Changing the ‘Limit’ and ‘Seed’ parameters will significantly influence the model output.
For each request in this hour slot – in time order –
- Determines which vehicle class(es) can respond to the request on the basis of incident type. Then for a vehicle class:
- Is there an appliance available at time of request-assignment at the nearest station to the incident?
- If yes then mark the appliance as busy until the request release time and get next request
- If No then is there an appliance free at a neighbouring station (more on this later too)
- If yes then mark the appliance as busy until the request release time and get next request
- If No, see if our initial station has capacity for another vehicle (if we have one from the unallocated pool)
- If a vehicle can be placed at this station then do so and mark it as busy until the release time
- If no then see if another vehicle can be placed at a near station
- If yes then place a vehicle at the near station and mark it as busy until the release time
- If No, then go back to step 2 for the next vehicle class determined in step 1. If there are no more vehicle classes to try then the model cannot respond to the request and the total for ‘Unresourced in this hour is incremented.
